
Chart
Every token page centers on a live Solana trading chart — full-featured candlesticks built on the industry-standard TradingView engine. Candles update live as trades happen, and the chart doubles as a trading surface — you can inspect trades inside a candle and place limit orders directly on it.
Timeframes
Section titled “Timeframes”Choose from timeframes ranging from 1 second to 1 week: 1s, 5s, 15s, 1m, 3m, 5m, 15m, 30m, 1h, 2h, 4h, 6h, 12h, 1D, and 1W. The most common ones (1s, 15s, 1m, 5m, 1h) are pinned in the toolbar for quick switching.
Sub-minute candles make the chart well suited to fresh launches, where most of the action happens in the first minutes.
Market Cap vs. Price and USD vs. SOL
Section titled “Market Cap vs. Price and USD vs. SOL”Two toolbar buttons change what the vertical axis represents:
- MarketCap/Price — plot the token’s market cap or its unit price
- USD/SOL — denominate the axis in USD (the default, like every other figure on the page) or in the chain’s native currency. This is a chart-view choice only: it changes how the axis reads, never the amount you trade.
Indicators and Drawing Tools
Section titled “Indicators and Drawing Tools”The chart includes the standard TradingView toolset: technical indicators, drawing tools, and chart-type options. Your studies and drawings work the same way they do on any TradingView-powered chart.
Trade Marks
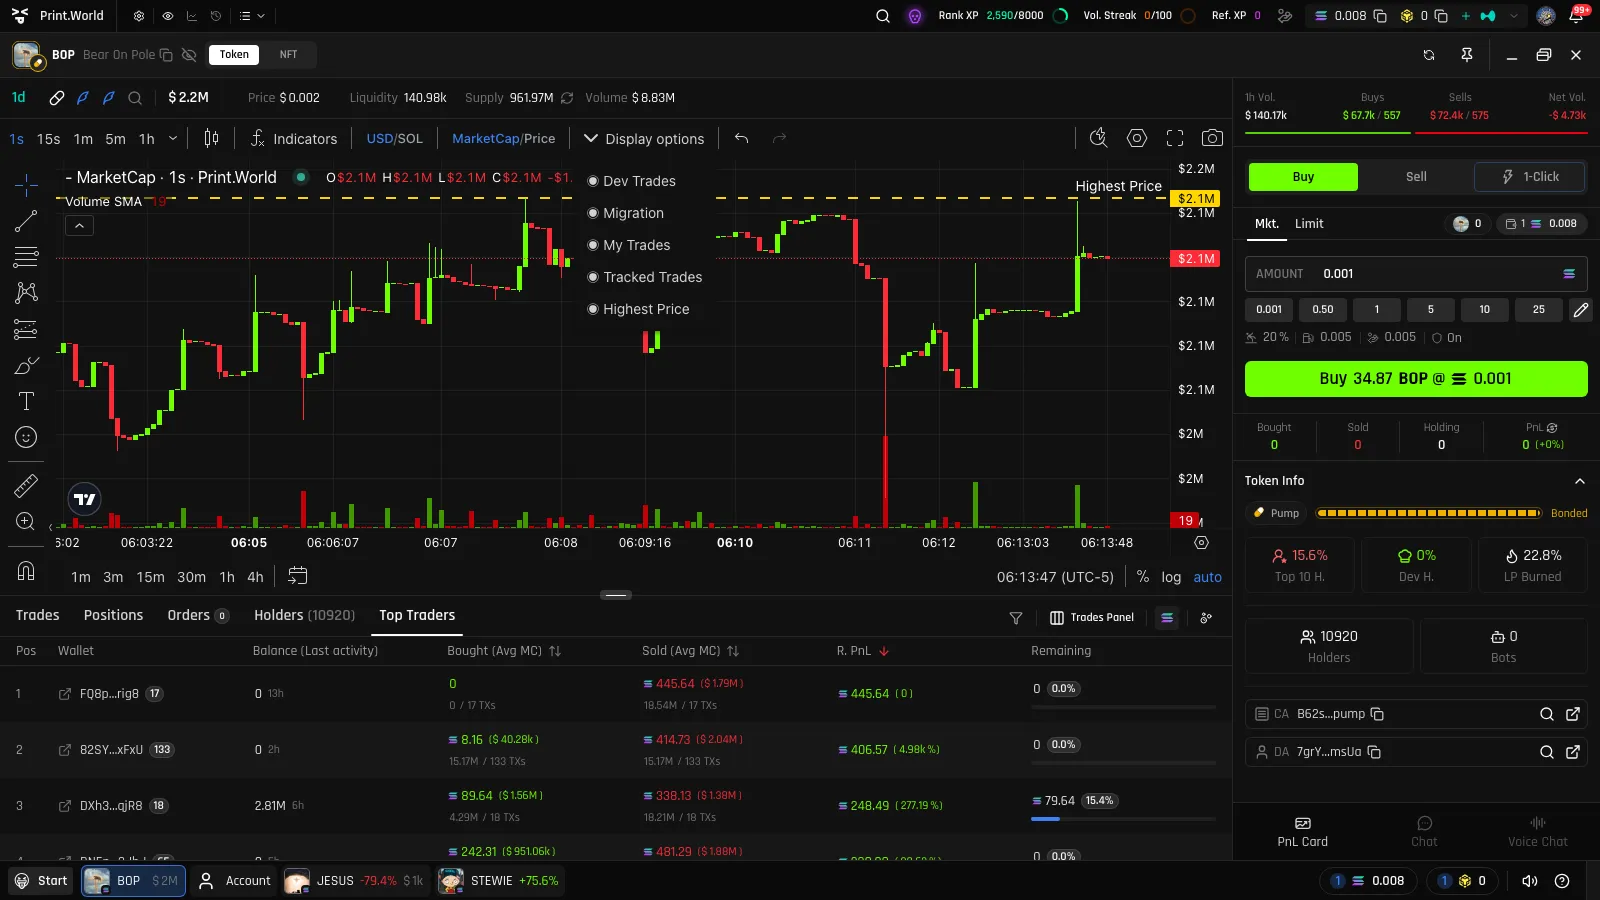
Section titled “Trade Marks”The chart can annotate candles with marks showing who traded and when. Each mark type can be toggled in the chart’s display options menu:
| Mark | Label | Shows |
|---|---|---|
| My Trades | B / S | Your own buys and sells |
| Dev Trades | DB / DS | Buys and sells by the token’s developer wallet |
| Tracked Trades | custom | Trades by wallets you follow in Wallet Tracker, with your custom labels |
| Verified Trades | TV | Trades by verified accounts |
| Migration | M | The moment the token migrated to a DEX |
Price and P&L Lines
Section titled “Price and P&L Lines”Beyond candles, the chart overlays several horizontal lines:
- Highest Price — a golden line marking the all-time high on the chart.
- Break-even and average entry — when you hold a position, the chart draws your break-even price and your average entry, consolidated across all your wallets that hold the token. See P&L Tracking.
- Limit-order lines — each active limit order appears as a line at its trigger level. Hovering an order in the Orders table highlights its line, you can filter the lines by wallet, and editing an order shows a dashed preview of the new level. See Limit Orders.
How to Inspect a Candle
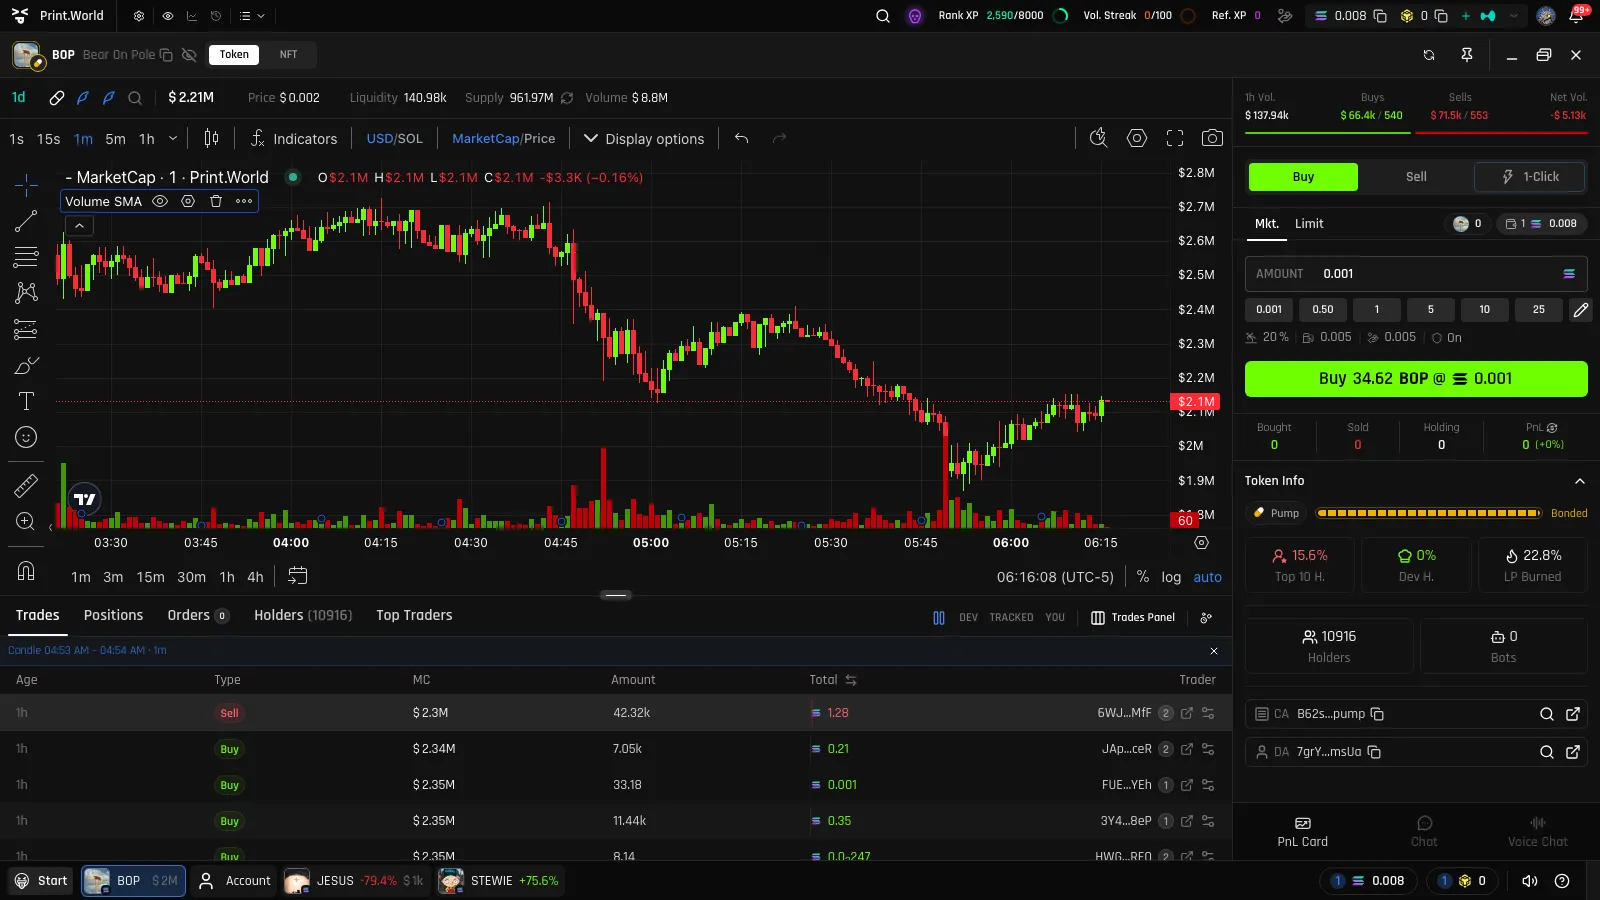
Section titled “How to Inspect a Candle”Click any candle to open candle mode in the Trades table: it lists only the trades that happened within that candle’s time range, with the from/to timestamps shown. Clear the filter to return to the live trade feed.
This is the fastest way to answer “what happened in that wick?” — one click takes you from a price move to the exact trades behind it.
How to Place Orders From the Chart
Section titled “How to Place Orders From the Chart”You can place limit orders without leaving the chart:
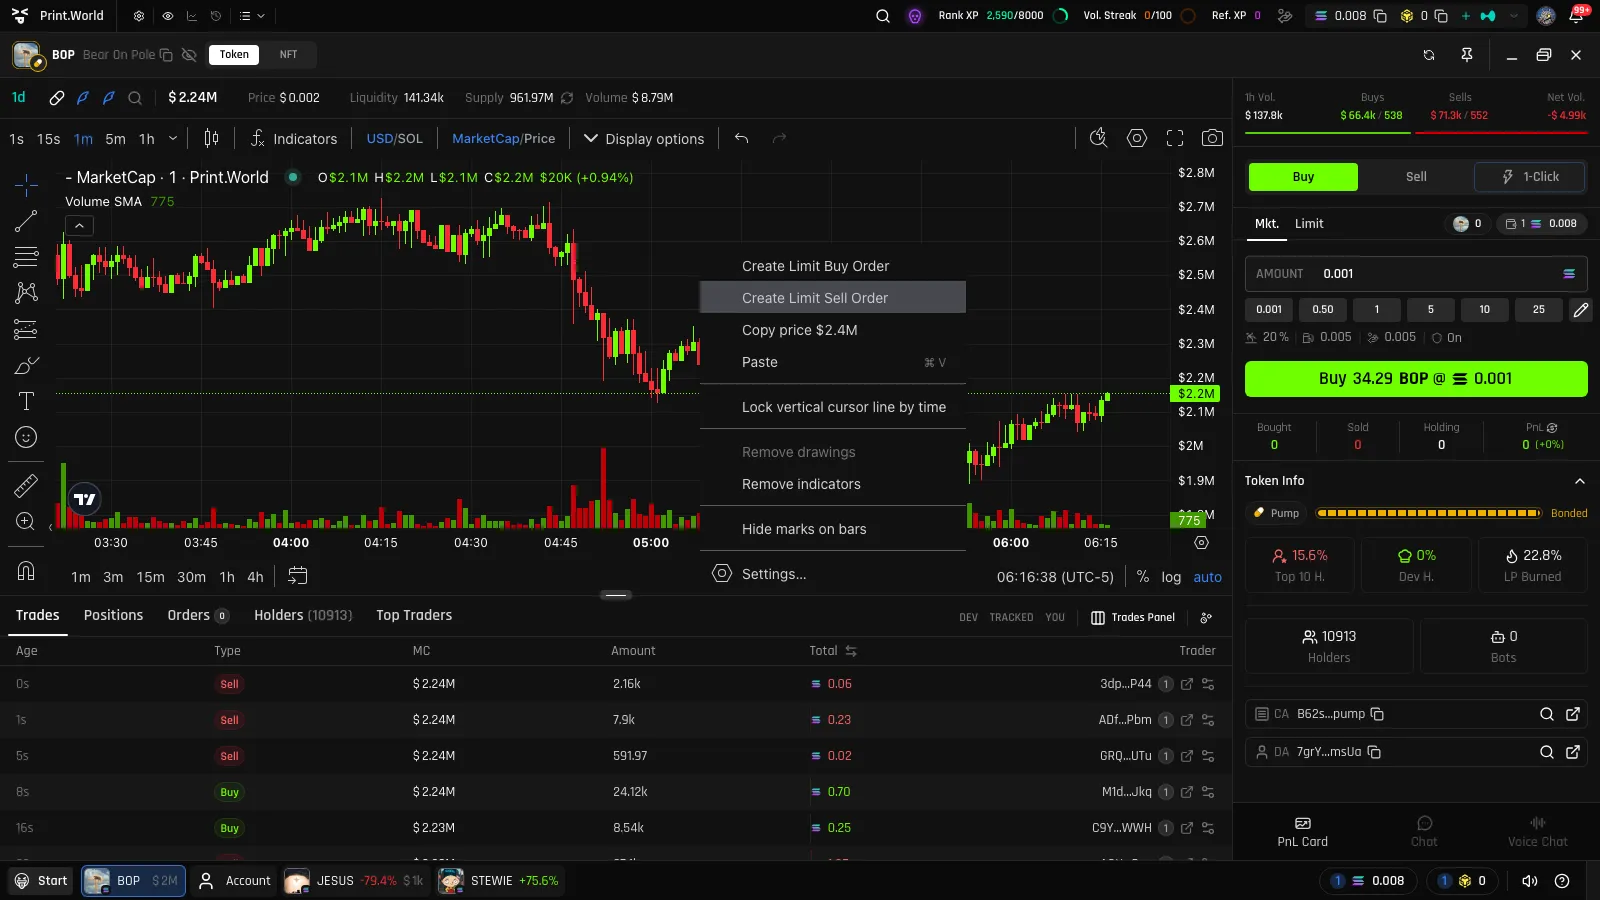
- Right-click anywhere on the chart and choose Create Limit Buy/Sell Order. An order card opens, pre-filled with the price level you clicked.
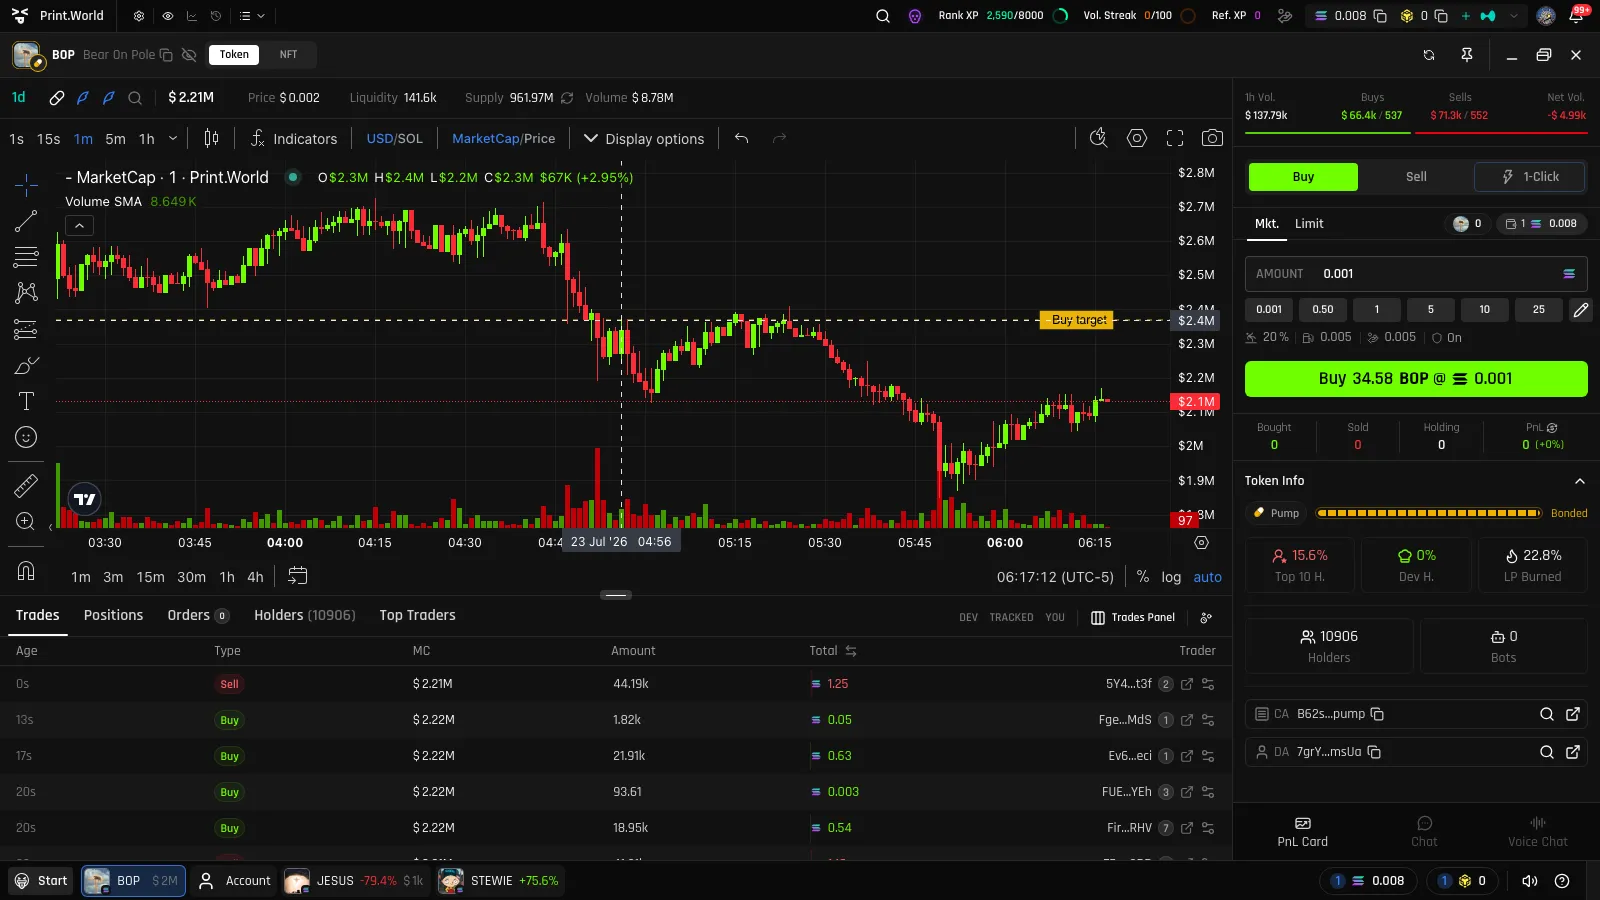
- Hotkey — hold your configured hotkey and a dashed Buy target or Sell target line follows your cursor. Click to place an order at that exact level. The direction comes from which hotkey you hold, and with the 1-click limit card enabled the order is submitted instantly with your preset amount.
See Limit Orders for how orders work once placed, and 1-Click Trading for hotkey setup.